How Much is Chart Abstraction Costing You?

October 29, 2025
.png)
Manual chart abstraction remains one of the most expensive, underestimated steps in clinical research and quality improvement. We analyzed over 100 projects to understand just how much time teams spend, and created a calculator so you can see what abstraction costs your project and benchmark against our data.
The High Cost of Chart Abstraction
Chart abstraction (the process of manually extracting structured data from clinical notes) is an essential but resource-intensive task in healthcare research and operations. Studies consistently show that the effort adds up quickly:
- One retrospective study estimated it would take 8–25 full-time staff to capture just one type of cancer recurrence at a single hospital.
- In research, manual abstraction can cost hundreds of dollars per patient record when accounting for review time, validation, and data entry.
- Across clinical programs, those hours compound into tens of thousands of person-hours each year.
For many investigators, this work is invisible in budgets; it’s simply “what we have to do to get the data.” But as projects scale, the hidden cost becomes striking.
Our Dataset
To better quantify this burden, we looked at roughly 100 manual chart abstraction projects that reached out to Brim Analytics. Most were research-oriented: registries, observational studies, and clinical workflow automations.
For each, the principal investigator self-reported the average weekly hours spent on abstraction. It’s worth noting that self-reporting often underestimates real effort. In one study, experiment participants underestimated the time that would be required for even simple tasks routinely, with the amount varying by their familiarity with the task, the task's duration, and other variables. In chart review contexts, administrative tasks like data cleanup, variable clarification, or double-checking entries are rarely captured in “abstraction time.”
We therefore hypothesize that the true effort per project is higher than what was reported.
Chart Abstraction Cost: Overall and Distribution
Across these 100 projects, we found a combined 30,000+ hours of manual abstraction effort—the equivalent of 15 years of full-time work devoted to chart review.
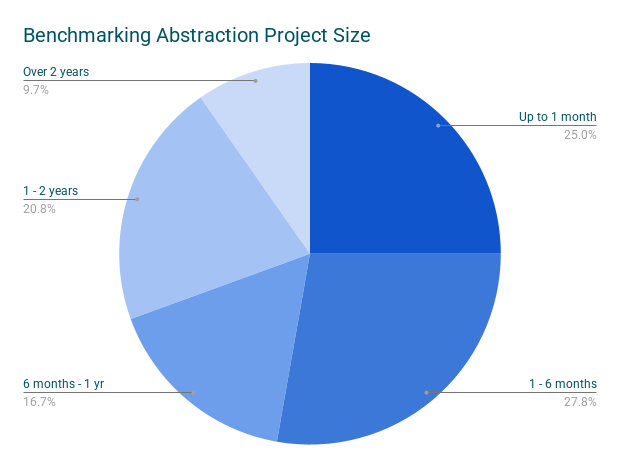
When categorized by duration:
- Up to 1 month: 25%
- 1 - 6 months: 27.8%
- 6 months - 1 year: 16.7%
- 1 - 2 years: 20.8%
- More than 2 years: 9.7%
Even the “small” studies (those under six months) represented hundreds of hours of staff time, often distributed across trainees, coordinators, and faculty reviewers.
Calculate the Chart Review Cost for Your Project
Curious what abstraction might be costing your team?
Try our interactive Chart Abstraction Cost Calculator:
brimanalytics.com/abstraction-calculator
Enter the number of people and their weekly hours, and you’ll be sent a personalized report with the annual labor cost, benchmarks against our data set, and some recommendations for how to streamline processes.
How Do I Reduce the Cost of Manual Abstraction?
Standardize Fields
Start by simplifying and standardizing what you collect.
When variable definitions are clear and structured, abstractors spend less time deciding what counts and reviewers are more likely to agree.
Creating a stored library of fields that includes instructions, allowed values, and examples can reduce disagreement between reviews and improve results.
Automate Abstraction
Manual abstraction is time-intensive, and even the most disciplined manual processes have accuracy limits.
That’s where Brim comes in.
Brim enables AI-guided chart abstraction: you define the variables you need, and large language models assist by extracting candidate values directly from clinical notes. Each data point is accompanied by evidence, so reviewers can validate quickly instead of re-reading entire charts.
Institutions using Brim have:
- Reduced manual review time by 75% of more.
- Standardized definitions across studies and registries
- Built audit trails for validation and drift monitoring
By combining human judgment with AI assistance, Brim helps teams spend less time clicking through EHRs and more time analyzing and improving care.
Key Takeaway
Manual abstraction isn’t just tedious; it’s expensive.
Quantifying that cost is the first step toward changing it.
👉 Use the Brim Abstraction Cost Calculator to see how much time your team is investing, and explore how AI-guided workflows can help you reclaim it.